Our Science
We are committed to science, and to make it accessible to as many people as possible. After 80 years of prohibition, in which scientific research on cannabis was restricted, there are still many gaps and misconceptions around the cannabis plant’s morphology and composition. Through patented technology and rigorous research, we are doing our best to assist anyone who would like to know this plant better with the goal of improving their lives.
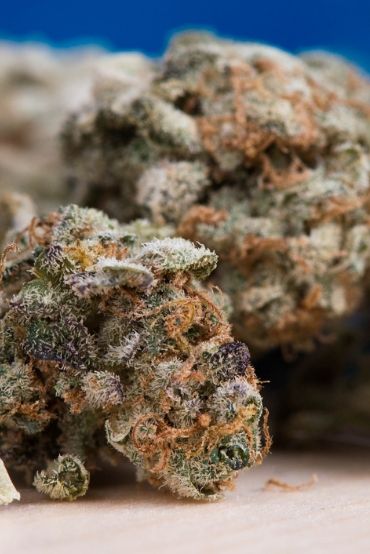
Potency variation (heterogeneity) within cannabis flowers affects you every time you consume them
Cannabis flowers are like us – no two are the same. There are huge differences between cannabis strains, between plants of the same strain, between flowers on the same plant, and even inside each flower! However, today’s testing is done mostly through HPLC - a method designed for uniform substances (such as beverages), which is unfit to test cannabis flowers due to their inherent variability. The HPLC test is also destructive to the sample, which means that 100% of the flowers on the market were not directly tested! In fact, only 0.5% (average) of a batch is taken to regulatory demanded HPLC testing, with the primary goal of detecting pesticides and other chemicals – potency testing is secondary to that. And finally, even if you knew a batch’s precise average potency, it doesn’t mean you know the potency of the specific flowers you purchased, because of the huge variability within one batch. Sadly, it has become a “fact of life” - when it comes to cannabis flowers, people just don’t know how to consume them, and if they paid the right price for them.
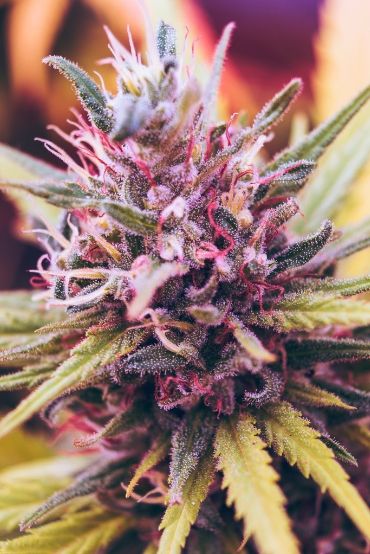
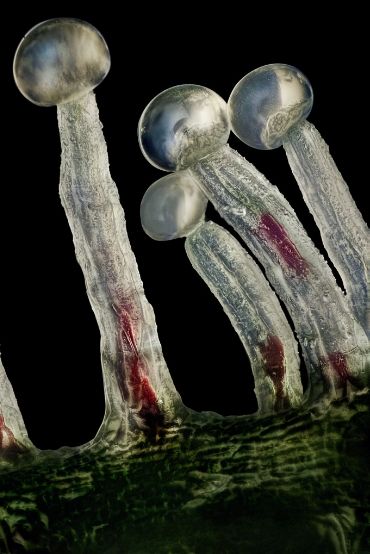
Welcome to the world of trichomes
Some call them crystals, others glitter. Their scientific name, though, is Trichome (“hair” in Greek), and they are abundant throughout the plant kingdom. Stalked-capitate trichomes are the factory and reservoir of everything you love about cannabis. As the plant matures, they swell and change their color, while cannabinoids, terpenes and flavonoids accumulate and metabolize. Since they are on the surface of the flower, looking at them means looking at the plant’s chemistry. In fact, this is how growers know when to harvest cannabis, and there have been studies linking the appearance of trichomes in visible spectrum on the flower surface with its chemical composition. After realizing we can help growers know when to harvest, we realized we can help the consumers themselves to test their cannabis at home. Now, if you wanted to check sugar levels in green apples, for example, it would be impossible to do so just by looking at them – sugar is found mostly under the skin, where it is evenly spread. Measuring cannabinoids is different in that sense – the active compounds are right there on the surface, conveniently arranged in very concentrated “bubbles” – the trichome heads. Observing them in the right resolution (hence the HiGrade Scope’s magnification) is key to understanding their chemistry.
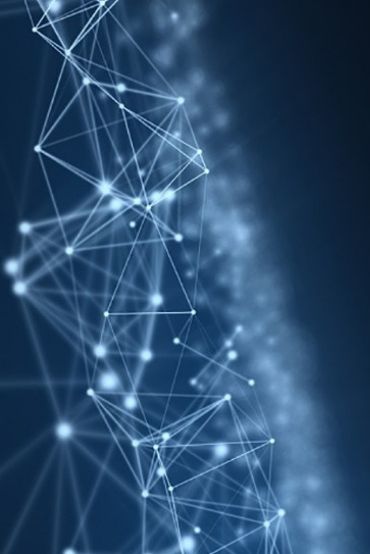
Training algorithms with chemical analyses
We are often approached by people who assume that in order to calculate potency, we look for the images in our database that are the most similar to the ones they uploaded. We don’t do that. Over the course of 3 years, we have collected many samples of cannabis flowers, collected images from each one, and sent each to an HPLC test in regulatorily approved labs in the US. This way we created a huge database of microscopic images of cannabis flowers and their corresponding chemical analyses. We then used this dataset to train a state of the art image recognition algorithm – deep neural networks (deep as in deep learning, a branch of AI). At every step of the learning process, samples are fed into the neural network – images and their corresponding potency (HPLC result). With each step, the algorithm tries to predict the chemical analysis which fits the image – and corrects itself if it was wrong. Over time, the network graph learns what features in the image matter and how much they matter. After millions of such steps, our algorithm found over 2000 such features, and reached a predictive ability of 85% accuracy. So what happens when you upload an image? Your image is being fed into our neural network, and the potency is calculated directly from it, depending on your image’s extracted features, and on each feature’s relative importance.
Let’s talk accuracy
It takes a whole machine to make sure the image we get from you is of high enough quality. We make sure it’s not blurry, not dark, that it’s taken with the right magnification, correct lighting, etc. Only a good enough sample enters the potency algorithm – the trained network discussed above. At the end of the training process, a test set of samples (which we have chemical analyses of, but the network was not exposed to during the training) was evaluated by the trained network. We calculated the deviation of the network’s prediction for each of the samples in the test set, and the resulting deviation average (RMSE) for the THC testing is 15% (statistical), which can be translated to +/-3% THC on average. As we mention on the app and this website, the accuracy value is true only when testing 3 different locations (to account for in-flower variability) of dry flowers originating in THC-only strains (normally having less than 1% CBD). It is important to note that like other testing methods, it has its limitations, and if you intentionally try to fool it – you may succeed. The true indicator for quality of any testing method is how well it performs when used according to its protocol, so we encourage you to put us to the test – as long as you follow the testing instructions carefully.